In the example below we show how the use of manures could dramatically reduce input costs.
Example farm
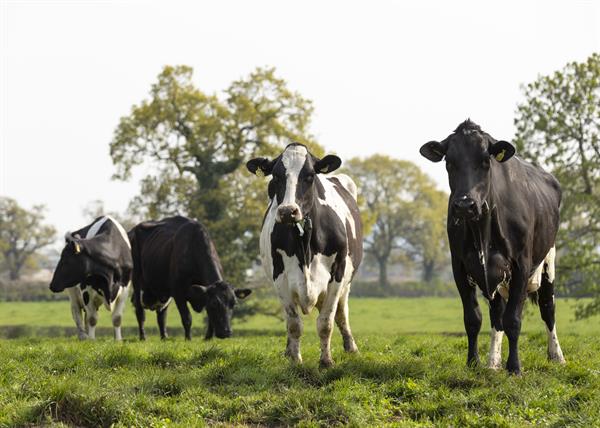
In this case, the farm is a mixed dairy and arable farm with 150 cows and followers on 80 ha of grass, the farm has 110 ha of spring-sown crops.
The slurry and farmyard manure produced alongside the imported biosolids were used on the grass and spring sown crop. All of the manures were applied in the spring or on the grass mid-season.
- 50 ha of spring barley
- 35 ha of spring rape
- 25 ha of forage maize
The calculations below show the cost of bagged fertiliser for the whole farm, and the potential value of manures which could be applied. The cost of fertiliser for the crops has been valued as £36,403 and use of the manures (both produced on farm and imported) would reduce this by £8,236. This shows, by maximizing manures farmers are able to make significant savings.
Fertiliser
This section highlights the total cost if bagged fertilizer alone was used on the farm. Rate of application was based on AHDB’s RB209, and for the purpose of this exercise nutrient costs were assumed at £0.66/kg N, £0.55/kg P2O5 and £0.40 /kg K2O.
Rate of nutrient application (based on RB209) were:
|
Nutrients recommended (kg/ha) |
||||
|---|---|---|---|---|
|
Crop |
ha |
N |
P2O5 |
K2O |
|
Dairy/heifer (150 cows) |
80 |
240 |
75 |
70 |
|
Spring barley |
50 |
140 |
105 |
95 |
|
Spring rape |
35 |
120 |
60 |
50 |
|
Maize |
25 |
100 |
55 |
175 |
The cost of these nutrients, if applied as manufactured fertiliser, would be:
|
|
Nutrient cost (£) |
|||
|---|---|---|---|---|
|
|
N |
P2O5 |
K2O |
Total |
|
Dairy/heifer (150 cows) |
12672 |
3300 |
2240 |
18212 |
|
Spring barley |
4620 |
2888 |
1900 |
9408 |
|
Spring rape |
2772 |
1155 |
700 |
4627 |
|
Maize |
1650 |
756 |
1750 |
4156 |
|
Total |
21714 |
8099 |
6590 |
36403 |
Manures produced and imported
Amounts of manures produced and imported were:
|
t or m3 |
|
|---|---|
|
Slurry |
1000 |
|
FYM |
400 |
|
Biosolids |
200 |
These manures were allocated to crops and provided nutrients as follows:
|
Manure |
rate t/ha |
Manure nutrients kg/ha |
Nutrient applied kg |
|||||
|---|---|---|---|---|---|---|---|---|
|
Crop |
N |
P2O5 |
K2O |
N |
P2O5 |
K2O |
||
|
Dairy/heifer (150 cows) |
Slurry |
10 |
10 |
12 |
25 |
800 |
960 |
2000 |
|
Spring barley |
Biosolids |
10 |
16 |
110 |
4 |
800 |
5500 |
200 |
|
Spring rape |
FYM |
11 |
7 |
35 |
103 |
245 |
1225 |
3605 |
|
Maize |
Slurry |
8 |
8 |
10 |
20 |
200 |
250 |
500 |
The values in the table above are crop available N (spring applied, incorporated in arable areas) and total P2O5 and K2O.
The nutrient value of these manures (using fertiliser values above) was:
|
Nutrient value (£) |
|||
|---|---|---|---|
|
N |
P2O5 |
K2O |
Total |
|
528 |
528 |
800 |
1856 |
|
528 |
3025 |
80 |
3633 |
|
162 |
674 |
1442 |
2277 |
|
132 |
138 |
200 |
470 |
|
1350 |
4364 |
2522 |
8236 |
Visit our Tools page for more information on nutrient and manure management.