If rough grazing, woodland etc are taken out, there are around 11 million hectares of agricultural land in the UK. So, if land is sampled every four ears, this is equivalent to 11 hectares per soil sample. Bearing in mind samples from much land in Scotland will be analysed by non-PAAG laboratories, this does not seem to indicate great dereliction of duty in taking samples.
But that's not the end of the story. The annual PAAG reports, first published in 2009, all show that only 10% of samples are at target indices for both P and K. Putting it another way, 90% of samples show the need to adjust the P index, the K index or both indices to get the best from the crop and the fertiliser used.
Percentages of all PAAG samples in P and K indices in 2014/15
| P Index | |||
|---|---|---|---|
| K Index | < target | target | > target |
| < target | 13 | 10 | 10 |
| target | 8 | 10 | 13 |
| > target | 6 | 10 | 21 |
In 27% of samples the P index was lower than the target 2 and in 33% of samples the K index was lower than 2-. Crop yields were at risk in the land from which these samples were taken. On the other hand, P index was higher than 2 in 44% of samples and K index was higher than 2- in 37% of samples. Fertiliser savings were possible (and probably were being made) in land from which these samples were taken.
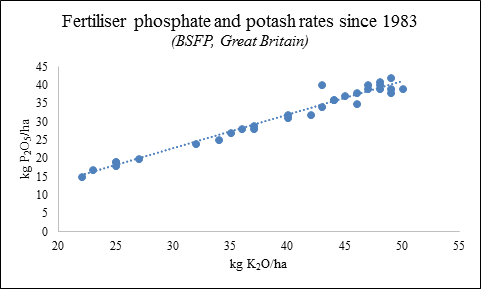
It does seem odd that after so many years of extensive soil sampling there should still be so much need to adjust indices. Part of the problem seems to be the close linkage of phosphate and potash rates applied to crops. The diagram below shows these for tillage crops and grassland in Great Britain every year since 1983 (from the British Survey of Fertiliser Practice). It can't be right that the phosphate and potash needs of the soil are so closely related. More likely application rates of these nutrients are related due to the widespread use of a limited range of PK compounds - historically grades like 0-24-24.
It looks as if it might not be the taking of soil samples that needs promoting so much as making use of the results. It really is worth getting phosphate and potash use right and soil analysis reports should be taken seriously by aiming for the closest possible match of application rate to soil index for phosphate and potash separately. It would be good to see PAAG reporting 90% of samples at both target indices instead of 10%.